Starting a running cheat sheet rather than a single post — commands and reference notes worth
keeping close, pulled from whatever I’m actually using that week. First entry: terraform graph, using the S3 + CloudFront stack
this site itself runs on as the example.
Rendering it on Windows
winget install Graphviz.Graphviz
Add to PATH:
C:\Program Files\Graphviz\bin
Generate the graph and render it:
terraform graph > C:\Temp\graph.dot

(Get-Content C:\Temp\graph.dot -Raw) |
  Set-Content C:\Temp\graph-clean.dot -Encoding ascii

& "C:\Program Files\Graphviz\bin\dot.exe" `
  -Tpng C:\Temp\graph-clean.dot `
  -o C:\Temp\graph.png
That middle step — re-encoding to ASCII — matters more than it looks. terraform graph’s
output on Windows can carry characters dot.exe chokes on depending on your shell’s default
encoding; re-saving as plain ASCII before rendering avoids a class of “why is Graphviz throwing
a parse error on a file I didn’t touch” problems.
Three graphs, not one
terraform graph isn’t a single command — the -type flag changes what you get, and the
three types answer different questions:
terraform graph                    # config-level dependencies only
terraform graph -type=apply        # full execution graph, incl. internal expand/close nodes
terraform graph -type=plan-destroy # the reverse: destroy ordering

The plain terraform graph (no -type) is the one to reach for first — it shows only
resources and data sources, no internals, which is exactly what you want when the question is
“what depends on what.” The apply and plan-destroy variants add a lot more nodes — module
expansion, provider open/close lifecycle, output and local evaluation — genuinely useful for
debugging a specific ordering problem, genuinely noisy for just understanding a config.
How to read the chart
1. Shapes matter
Confirmed straight from Terraform’s own DOT output, not just visual guessing:
- Box (rectangle) — a resource or data source.
aws_s3_bucket.site,data.aws_route53_zone.site. - Diamond — a provider configuration.
provider["registry.terraform.io/hashicorp/aws"]. - Note shape (a box with a folded corner — subtle enough to miss at a glance in a low-res
screenshot) — a variable.
var.domain_name,var.bucket_name. - Ellipse (oval), no explicit shape set — everything else:
(expand)and(close)internal lifecycle nodes, module boundaries, the root node itself. Only shows up in theapplyandplan-destroygraphs, not the plain one.
2. Arrow direction — the part worth double-checking
This is where it’s genuinely easy to get turned around, and not just for humans — there’s an open GitHub issue against Terraform itself pointing out that even AI tools misread plan-output arrows something like 40–50% of the time. Worth being precise about it here rather than trusting intuition.
The rule: A → B means A depends on B. The arrowhead points at the thing that has to exist
first. The node with the outgoing arrow — the tail — is the one waiting, and gets created or
evaluated after the node it points to.
aws_cloudfront_distribution.site
              |
              v
      aws_s3_bucket.site
Reading that correctly: CloudFront depends on the S3 bucket. The bucket has to exist first — CloudFront’s origin config needs to reference it — so Terraform creates the bucket, then the distribution. The arrow points at the dependency, not at “what happens next.”
It’s worth drawing this out explicitly because the instinctive reading — “the arrow shows the
order things happen in, left to right” — is exactly backwards from how Terraform’s own DOT
output actually works. A → B reads as “A needs B,” not “A, then B.”
3. Top node: root
[root] root
Only shows up in the apply/plan-destroy graphs. This is Terraform’s root module — everything
in a single, non-nested config belongs to it by default:
.
├── main.tf
├── outputs.tf
└── variables.tf
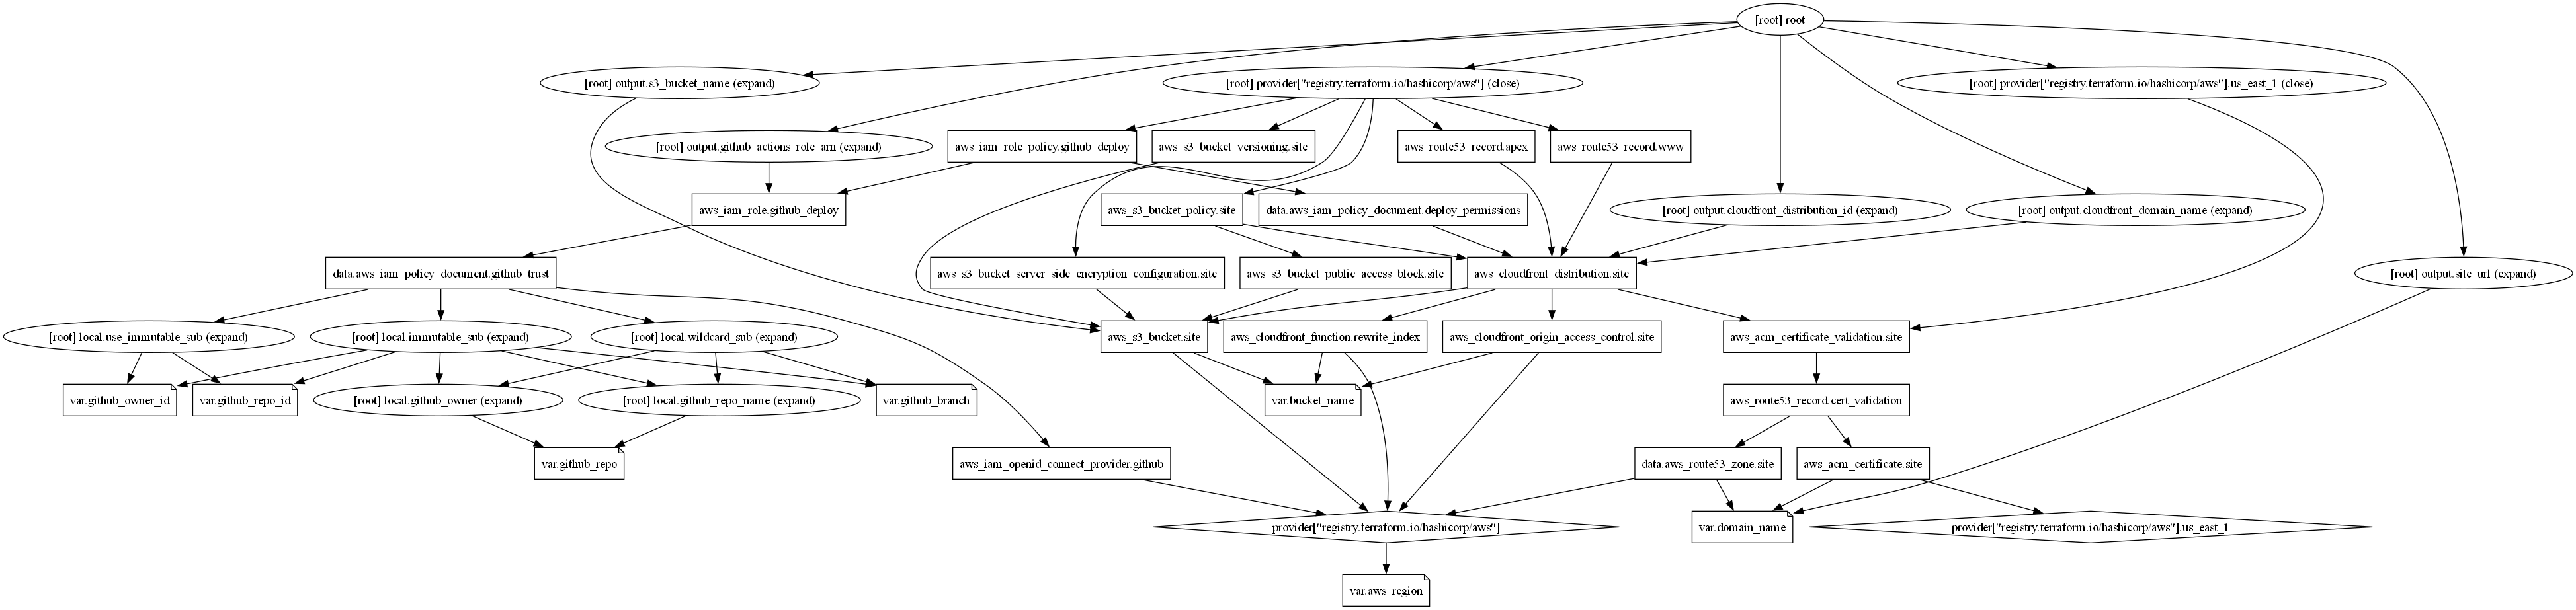
4. Locals and variables show up as their own nodes
Both get evaluated as distinct graph nodes, not inlined into whatever resource references them:
local.github_owner
local.github_repo_name
local.wildcard_sub
local.use_immutable_sub
var.github_owner_id
var.github_repo_id
var.github_branch
Worth remembering as the mental model: local.github_owner is a node computed from
var.github_owner_id and whatever expression the locals block defines — Terraform tracks
that as a real dependency edge, same as it would between two resources. If a local references
a variable, there’s a local.x → var.y edge in the graph exactly like there’d be one between
two resources.
5. Destroy inverts the direction of execution, not the arrows
terraform graph -type=plan-destroy

The graph itself looks structurally similar to the apply graph — same nodes, same edges, same “A → B means A depends on B” reading. What changes is which direction Terraform walks it: apply walks toward the arrowheads (dependencies first), destroy walks against them (dependents torn down first, dependencies last). CloudFront gets destroyed before the S3 bucket it depends on — makes sense, since you can’t safely tear down something another resource still points at.
More commands get added here as I actually use them — this isn’t meant to be a complete Terraform reference on day one, just the notes worth keeping.